Where to start
A dashboard with every metricA list of buildings
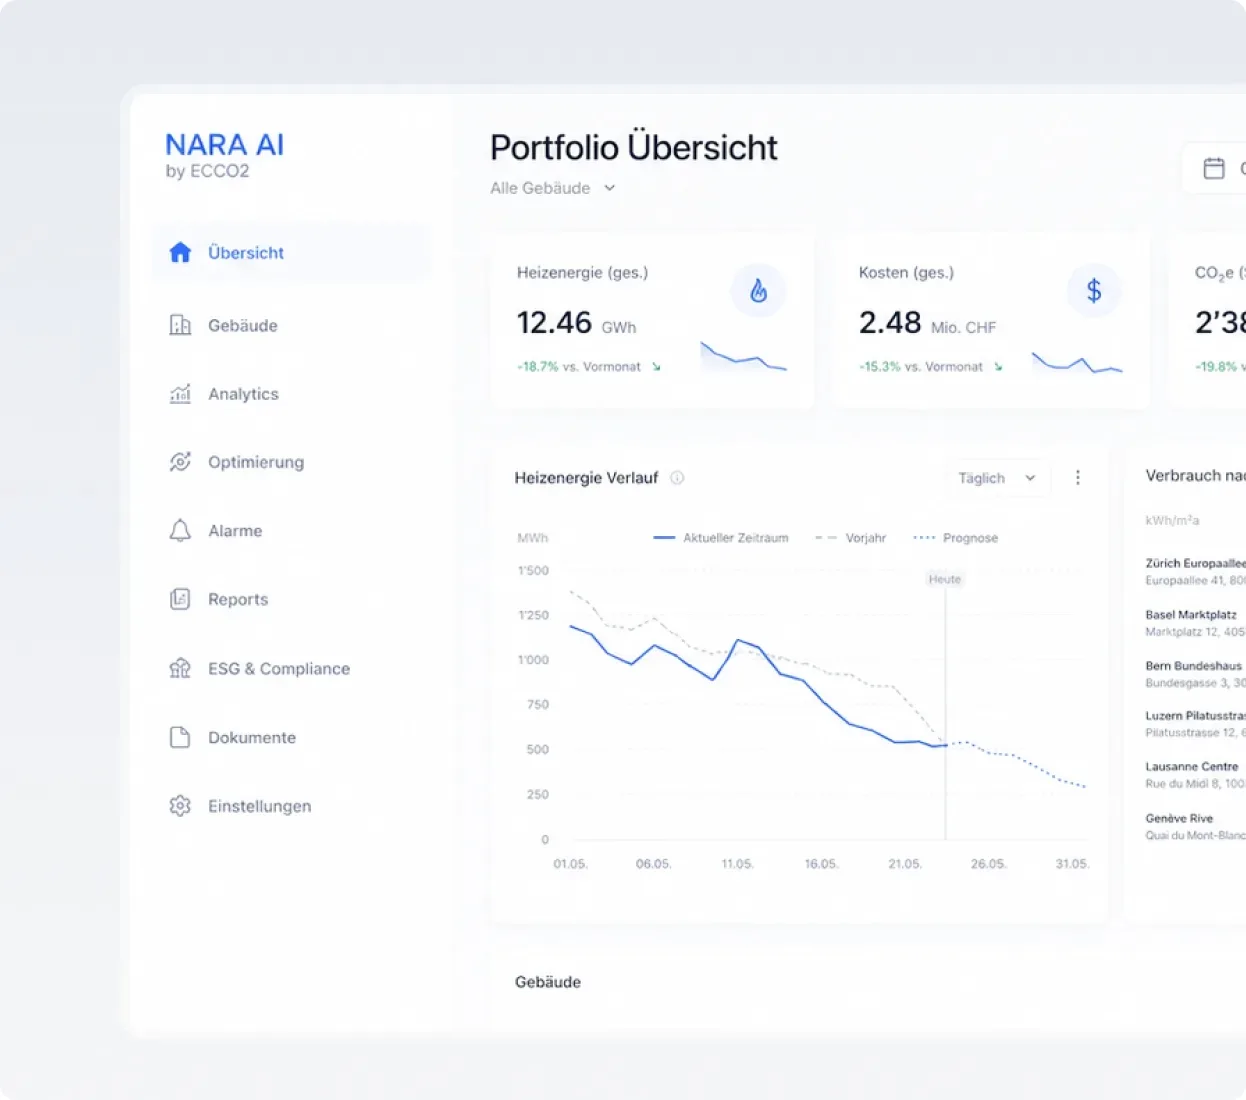
Savings first, details on demand
The answer goes on top; the data stays one click away.
Case study 02 · ECCO2 Solutions · Aug 2019 – Jul 20221 min read
As ECCO2's only designer and frontend developer, I kept its energy portal simple while it grew 50-fold.
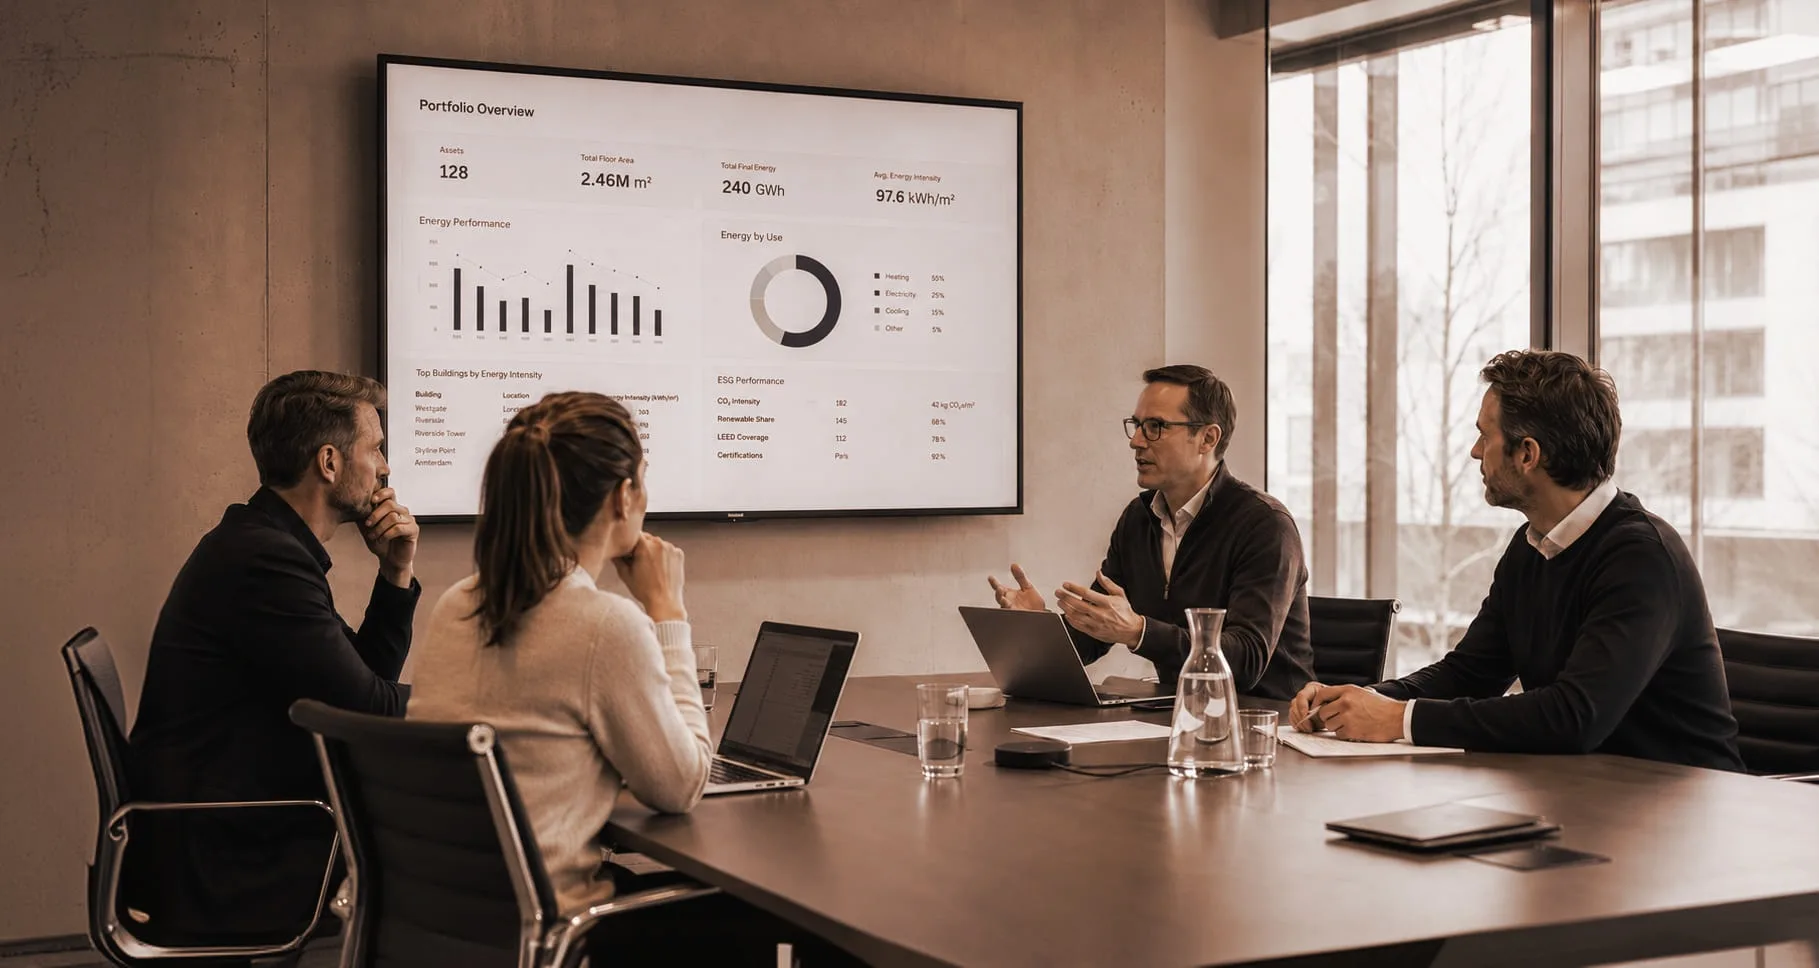
more data ≠ more screen
Managers had minutes and one question: are we saving energy?
ECCO2 optimises heating for real estate portfolios with AI. From 2019 to 2022 I did all of its design and frontend work. Every new building and sensor added data.
hardest part: saying no to new tabs
Where to start
A dashboard with every metricA list of buildings
Savings first, details on demand
The answer goes on top; the data stays one click away.
New features
A tab per featureA separate tool
No new tabs
Every feature earned a place in an existing view, so the portal grew in scope, not in navigation.
Design and code
Hand off specsDesign only in mockups
Build it myself
Ideas were tested in code the same week.
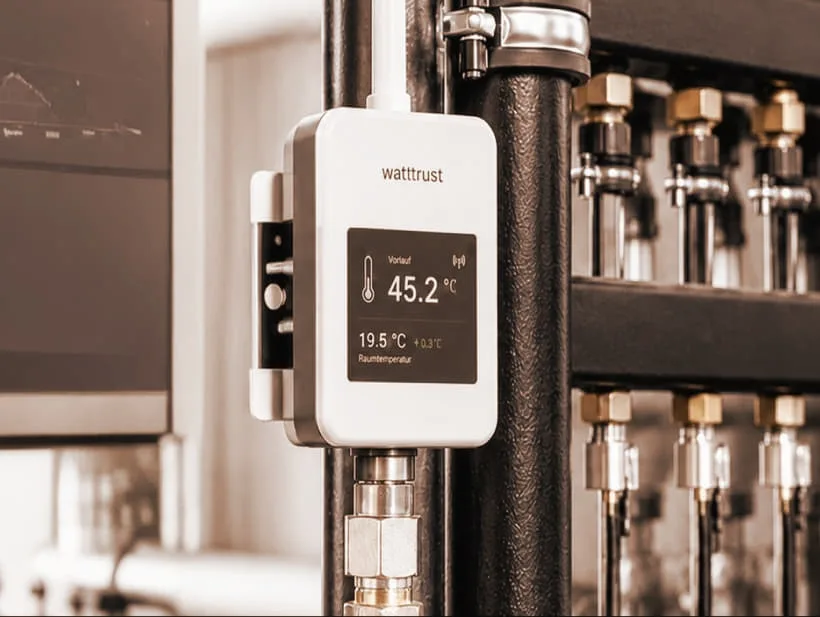
800+ buildings and 2M m², no redesign needed.
“We particularly appreciated his proactivity in proposing new solutions for user interfaces.”